Document Upload
Once you've created a workspace, it's time to fill it with data. The Documents section is where you upload files and—more importantly—where you understand what's in them before you start asking questions.
How to Upload
Open your workspace and expand the Documents section in the sidebar. You'll see an upload zone:
Drag and drop files onto the upload area, click Browse Files to select from your computer, or use Paste Text to add text content directly. You can upload multiple files at once.
Paste Text as Document
If your content isn't in a file—maybe it's notes, a snippet from a webpage, or raw text you want to analyze—click Paste Text to open the paste modal:
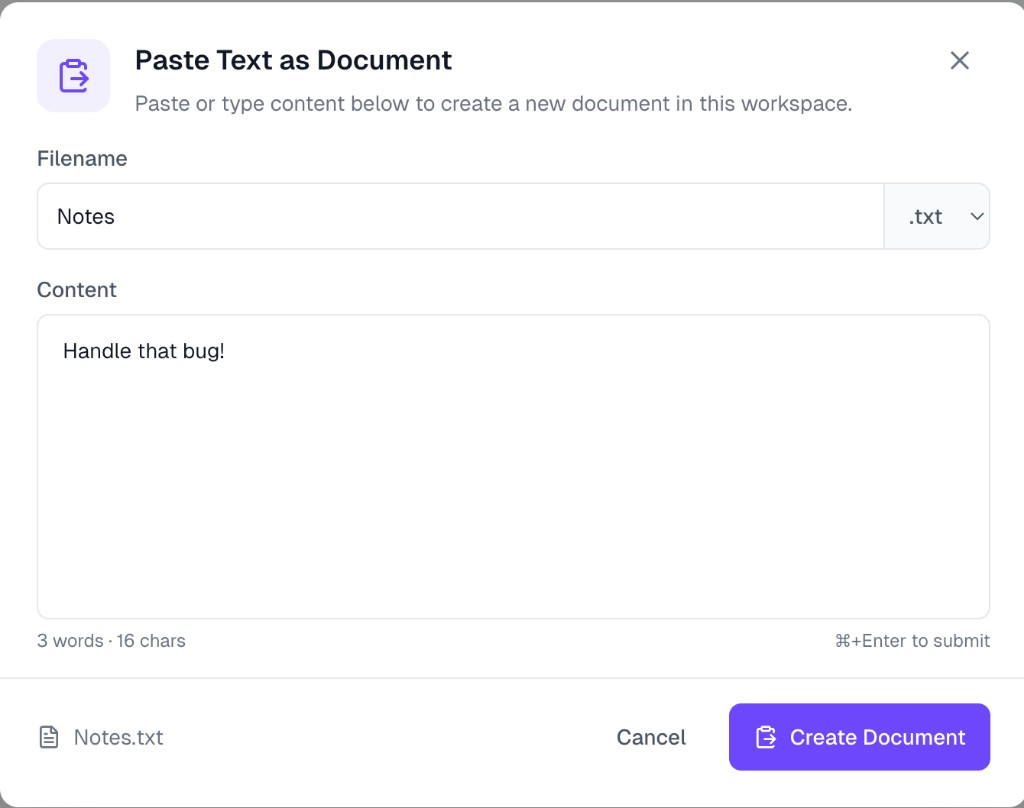
- Filename — Enter a name for your document. Choose the file extension from the dropdown (
.txt,.md, etc.) to match the content type. - Content — Paste or type the text you want to upload. The modal shows a live word and character count at the bottom left.
- Click Create Document to upload
The document appears in your workspace just like any uploaded file and goes through the same processing pipeline.
Supported Files
ParseSphere handles two categories of data, and it treats them differently:
Tabular Data — Structured rows and columns that become queryable with SQL:
- CSV (
.csv) - Excel (
.xlsx,.xls) - Parquet (
.parquet)
Documents — Unstructured text that gets indexed for semantic search:
- PDF (
.pdf) - Word (
.docx) - PowerPoint (
.pptx) - Text (
.txt)
All files have a 200MB size limit.
Processing Status
After you drop a file, ParseSphere processes it. You'll see a status badge next to each file:
- Processing — We're parsing the file, extracting data, and running analysis
- Ready — Done! Click the file to see details
- Failed — Something went wrong—usually a corrupted file or unsupported format
Processing time depends on file size and complexity. A small CSV finishes in seconds. A 50-page PDF with images takes longer because we're extracting text, chunking it for search, and pulling out images.
Understanding Your Tabular Data
Click on any ready tabular file (CSV, Excel, Parquet) to see what ParseSphere discovered. This isn't just a preview—it's actual analysis that helps you understand your data before asking questions.
File Overview
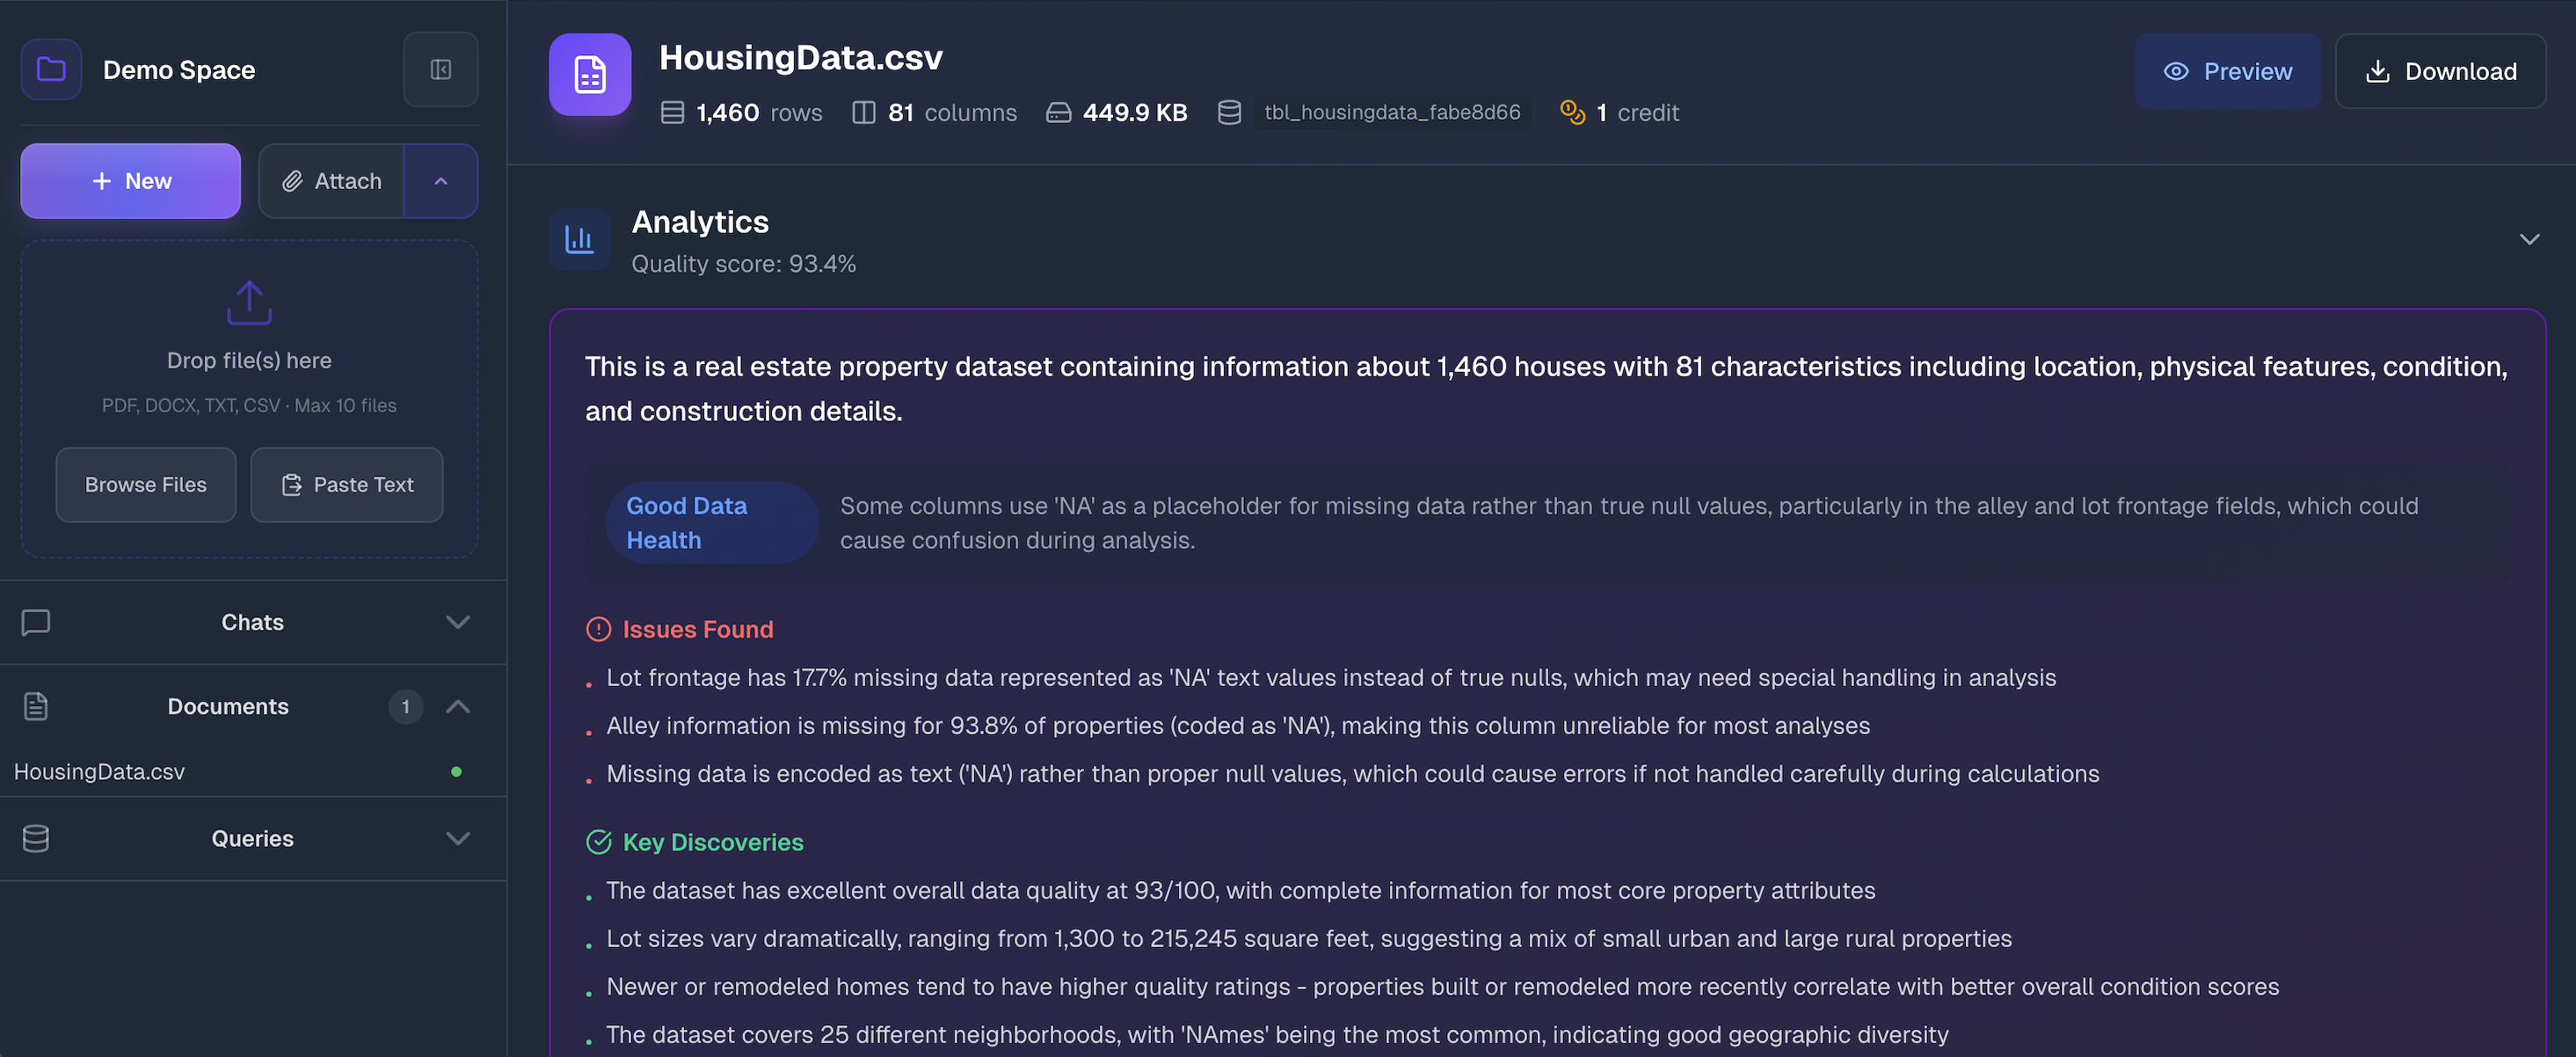
At the top, you'll see the basics: row count, column count, file size, and something like tbl_housingdata_11f96286. That's the internal table name—if you're curious about the SQL being generated during chats, this is what the AI references. Next to these stats you'll see the credit cost—this shows how many credits were consumed to process and analyze the file. Use Preview to view the raw data or Download to export it.
Context: Help the AI Understand Your Data
The Context section lets you describe your data in plain English. Click Add context to write something like:
"Sales transactions from our European stores. All amounts are in EUR. The 'rep_id' column refers to sales representatives."
Why this matters: Column names don't always tell the whole story. If your column is called amt, the AI doesn't know if that's dollars, euros, items sold, or something else. A few sentences of context eliminates guesswork and leads to more accurate responses.
You don't have to write a novel—just clarify anything that might be ambiguous.
Analytics: What the AI Discovered
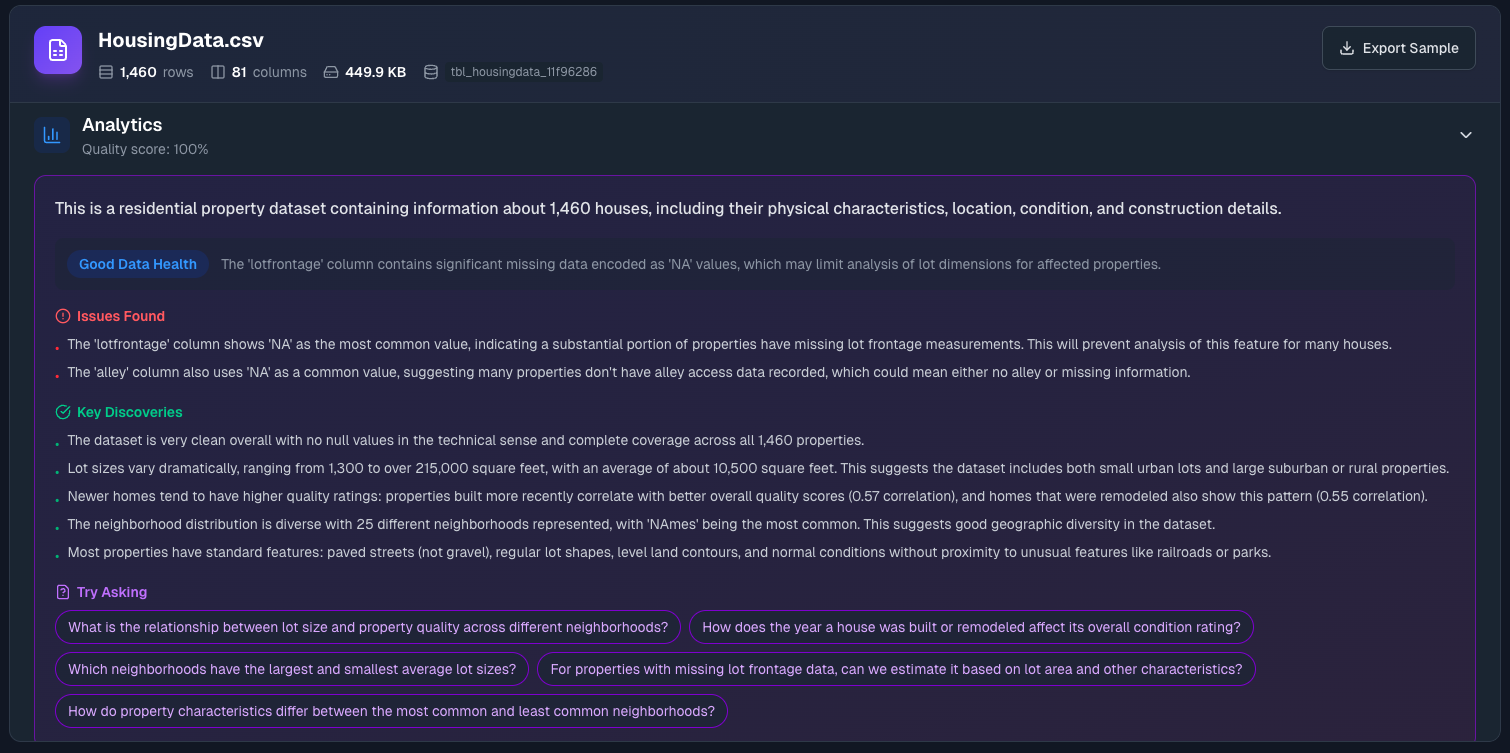
ParseSphere runs your data through automated analysis and surfaces what it finds:
Data Quality Score — A percentage based on completeness and consistency. High scores mean clean data. Low scores usually mean missing values or formatting issues.
Summary — A plain-English description of what the dataset appears to contain. The AI infers this from column names, data types, and patterns.
Data Health — Overall assessment with the main issue highlighted (if any). Watch for things like "The 'region' column has 15% missing values."
Issues Found — Specific problems that might affect your analysis. Common ones include:
- Columns where "NA" or "N/A" strings represent missing data (these look filled but aren't usable for calculations)
- Inconsistent formatting
- Unexpected data types
Key Discoveries — Interesting patterns spotted automatically. Things like "Most transactions fall between $100-$500" or "The 'premium' column strongly correlates with 'price'."
Try Asking — Suggested questions based on your data. These are great starting points—click any of them to jump into a chat.
Column Correlations
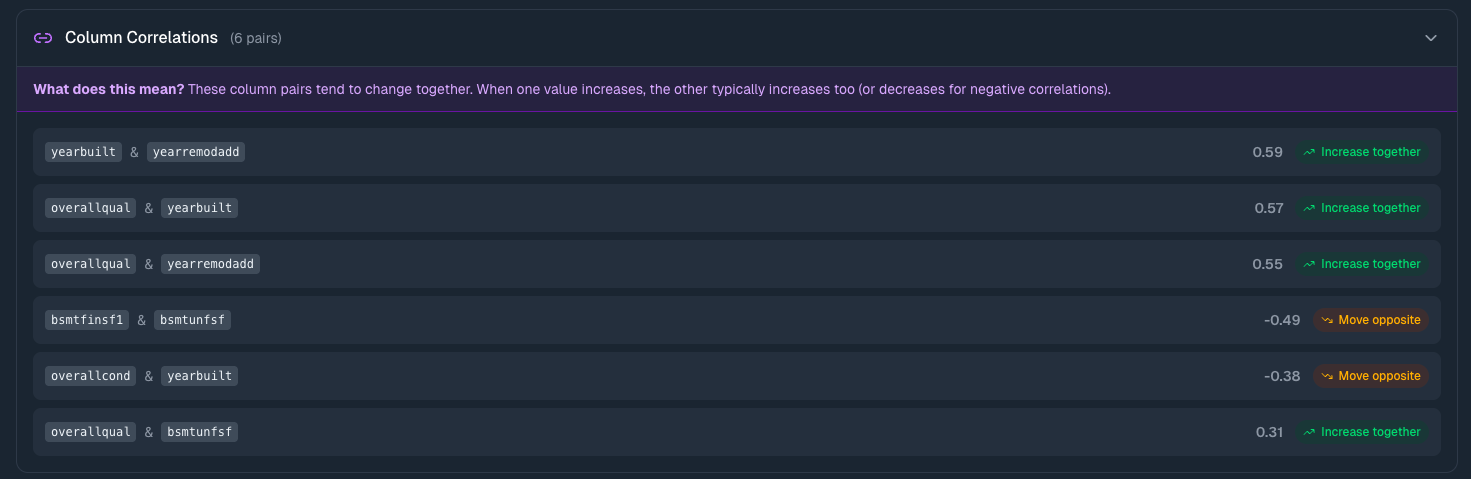
For numeric columns, you'll see a correlation table showing which columns move together.
What correlations tell you:
- Near 1.0 — When one goes up, the other tends to go up
- Near -1.0 — When one goes up, the other tends to go down
- Near 0 — No clear relationship
This matters because it reveals relationships you might not have noticed. If marketing_spend and revenue show 0.85 correlation, that's worth exploring. If temperature and ice_cream_sales correlate at 0.92, you've got a seasonal pattern.
Column Details
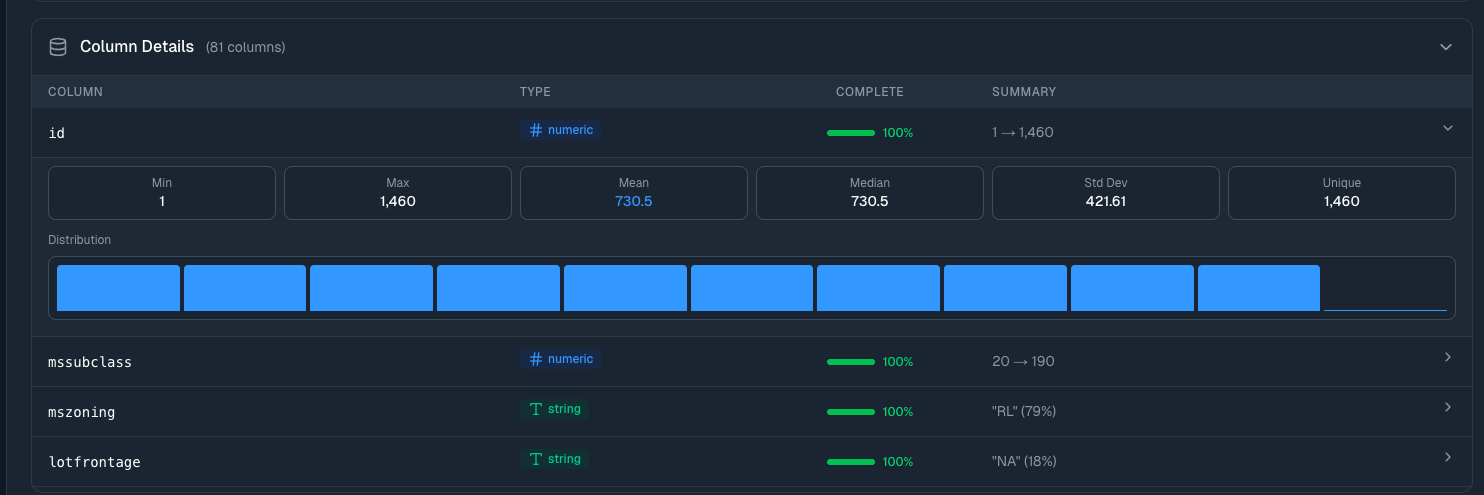
Expand Column Details to see statistics for every column in your dataset:
- Type (numeric, string, date) — Confirms the data was parsed correctly
- Completeness — Shows what percentage of rows have values—low percentages indicate missing data
- Summary — For numbers: the range (min → max). For strings: most common value and how often it appears
- Distribution — Visual histogram showing how values spread out
Click any column row to expand it further: mean, median, standard deviation, percentile breakdowns, and a larger distribution chart.
Why look at this? Data quality issues often hide in column-level details. A column that should have unique IDs showing "85% unique" means you've got duplicates. A numeric column with min of -999 probably has placeholder values that need cleaning.
Data Preview
At the bottom, there's a sample of your actual data—the first few rows. Quick sanity check that everything parsed correctly.
Version History
When you transform a dataset through the chat (adding columns, filtering rows, merging tables), ParseSphere creates a new version instead of overwriting your data. If a dataset has multiple versions, you'll see a version badge (e.g., v3) in the metadata row next to the column count.
Click the badge to open the version selector dropdown:
- Version list — Every version shown in reverse chronological order, with the active version marked with a checkmark
- Transformation summary — What changed in each version (e.g., "Added profit_margin column", "Filtered to Q4 transactions")
- Metadata — Row count and relative timestamp for each version
- Expiration — Inactive versions show an "Expires in X days" label. Versions are retained for 14 days after being replaced
Actions available:
- Download — Export any version as CSV, even if it's not the active one. Useful for comparing before and after
- Rollback — Click the rollback button to restore a previous version as the active dataset. This creates a new version (so you can always undo the rollback too)
Information
The original uploaded version (v1) can never be deleted. You can always get back to your raw data.
Understanding Your Documents
Click on a ready document file (PDF, Word, etc.) to see how it was processed. Documents are handled differently than tabular data—instead of becoming queryable tables, they're chunked and indexed for semantic search.
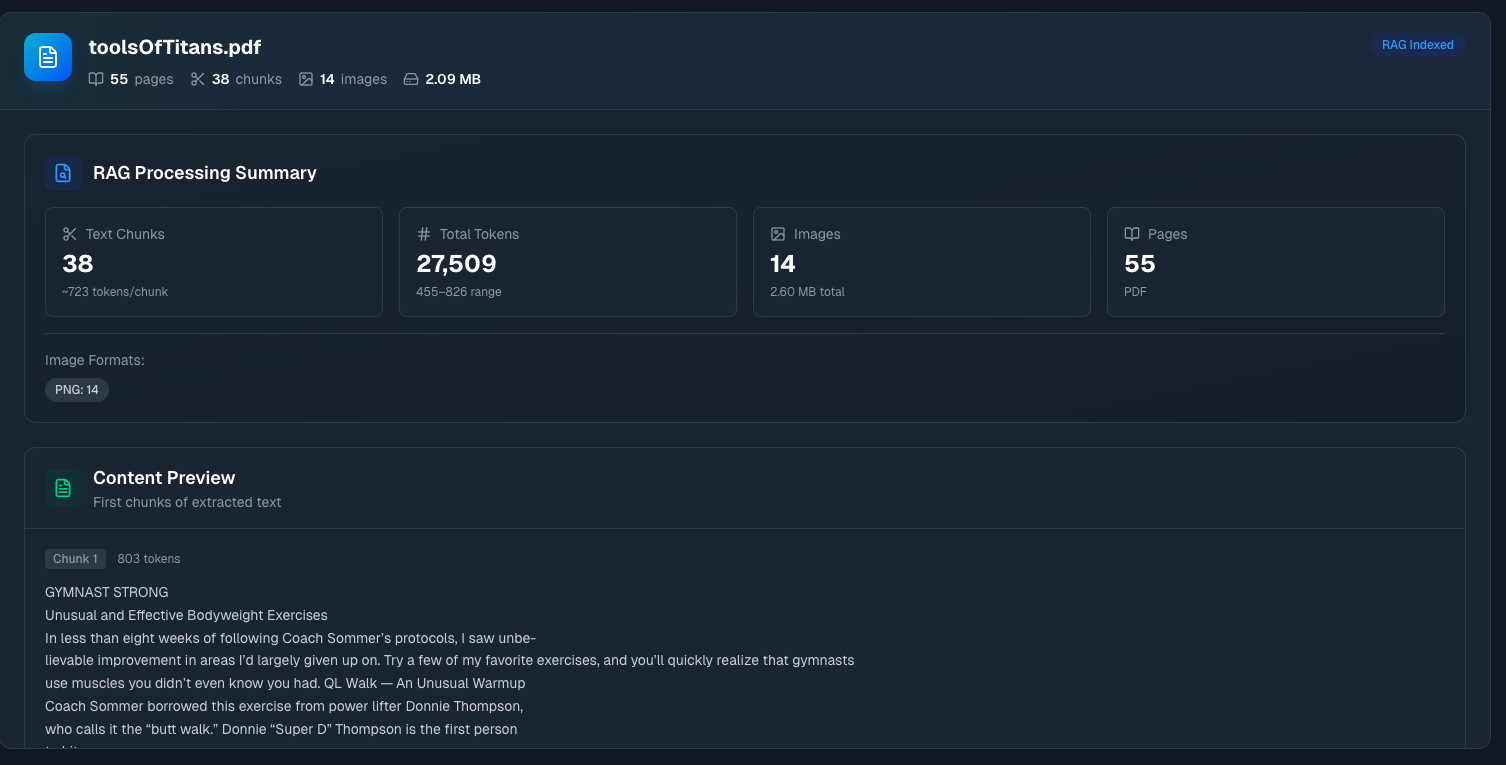
RAG Processing Summary
Text Chunks — Your document was split into smaller pieces for search. The number shown is how many chunks, plus the average tokens per chunk. Smaller chunks mean more precise search results; larger chunks provide more context per result.
Total Tokens — Combined token count with the range across chunks. This affects how much of the document can be included in AI context during conversations.
Images — Number of images extracted from the document, plus total size. If your PDF has charts or diagrams, they're pulled out separately.
Pages — Total page count, with the document format noted.
Image Formats — Breakdown of what image types were found (PNG, JPEG, etc.).
Content Preview
Below the summary, you'll see Content Preview—the first few chunks of extracted text with their token counts.
Why this matters: Sometimes document parsing doesn't go perfectly. Scanned PDFs might have OCR errors. Complex layouts might get scrambled. The content preview lets you verify that the extraction worked correctly before you start relying on it for answers.
If the preview looks garbled, the original file might need cleanup.
Tips for Better Results
Name your columns descriptively. customer_email tells the AI exactly what it's looking at. col7 does not.
Consistent date formats. Pick one format (YYYY-MM-DD works well) and stick with it. Mixed formats confuse parsers and AI alike.
Check the quality score. Before diving into analysis, glance at the analytics. A 65% quality score with "significant missing data" flagged means you should probably clean the source file first.
Add context for domain-specific data. Industry jargon, internal codes, currency assumptions—anything that isn't obvious from the data itself should go in the context field.
One topic per file. A CSV mixing sales data and employee information is harder for the AI to reason about than two separate files.
What's Next?
- Chat with Data — Start asking questions about your uploaded files
- Workspaces — Learn about organizing your data projects